
The House of Commons has just released it’s monthly housing figures. They can be seen here, and in summary:
House Prices
-
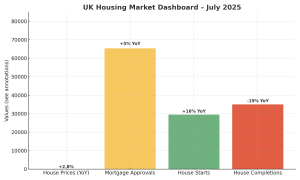
UK house prices rose 2.8% year-on-year (July 2024 → July 2025).
-
Prices fell 0.7% month-on-month (June → July 2025, seasonally adjusted).
-
Strongest annual growth: North East, Northern Ireland, North West.
-
Weakest: London, South East, South West.
Mortgage Approvals
-
65,352 mortgages approved in July 2025.
-
Up 5% on July 2024, and 1% on June 2025.
-
Approvals remain below post-pandemic highs but point to steady buyer demand.
Housebuilding
-
29,490 starts in Q2 2025 → up 2% on Q1, and 16% on Q2 2024.
-
34,990 completions in Q2 2025 → down 2% on Q1, and 19% on Q2 2024.
-
Starts peaked in mid-2023 as builders rushed projects ahead of new energy and EV standards; volumes since have normalised.
What it means for landlords and investors
-
Prices cooling, not collapsing: Annual growth is still positive, but month-to-month declines suggest softer conditions ahead.
-
Regional opportunities: Northern markets show strongest growth; London and the South remain subdued.
-
Mortgage market steadying: More approvals signal buyer activity, supporting sales pipelines and rental demand.
-
Supply squeeze: With completions falling, fewer homes are coming to market—keeping upward pressure on rents despite easing house price growth.
Next Updates
-
UK House Price Index – 22 October 2025
-
Bank of England Money & Credit – 29 September 2025
-
Housebuilding stats – December 2025
0 Comments